

Counting the Crowd
It’s incredibly important for event organisers to know how many people are likely to come to an event. With an accurate figure a whole lot of services and facilities can be better planned – public safety, emergency services, public toilets, parking, cleaning – there’s a lot of planning behind the scenes that can be done more efficiently if organisers know how many people they are catering for.
Counting the number of people attending large open air events is often complex. As the patterns of movement and behaviour are often unknown and even with advances in technology the methods through which people can be counted is limited and often difficult to implement.
Traditionally at events when tickets are not sold attendance is approximated by dividing an occupied area into sections; determining the average number of people in each section and multiplying this by the number of sections occupied. However this technique is not appropriate when the crowd is continually moving between locations.
So what kinds of events are we talking about? Really BIG ones such as Moomba. Since 1955 Moomba has been held annually in Melbourne. It is one of Australia’s largest free, and longest running, community festivals. It is celebrated during the Labour Day long weekend (over four days, from the first Friday to the second Monday in March). This video demonstrates a large crowd gathering to watch the Moomba Parade in 2011.
To address the challenge of counting crowds we use specific techniques for counting a moving crowd. The ultimate crowd counting techniques enable real-time information to event planners. These solutions use data fusion techniques to combine data from a number of sources over the life of the event. For example at the Moomba parade the life of the event can be described in four main phases – Pre Event, Event Build-Up, Event Peak and Post Event.
1. Pre-Event
At this stage the number of people at the event location is based on the usual number of people at the locations. Data which can assist with understanding the pre-event build up include the weather conditions (with people more likely to attend an event if the conditions are appropriate) and public transport. Note that the timetable due to road closures and the inclusion of free public transport understating the location and availability of public transport could potentially be an indicator of the timing of the crowd arrival and the advertised event program.
Social media data can also be used to understand how the mood of the city in relation to the event which could indicate the ‘likelihood’ of people coming to event.
2. Event Build Up
At this stage there is increased activity at the locations. As there are multiple events which can occur within a large event there is potential for interaction or ‘cross overs’ as one event ends and another takes place. Potentially this activity can be monitored through the surveillance of the frequency of the arrival of people into the city. The main data sources of event build up are the counts of people either via pedestrian sensors or manual counting.
3. Event Peak
At the peak of the event the crowd has reached a maximum.
4. Post Event
Within this stage the crowd disperses away from the event through the transport network. The timing of this phase can have a great impact if there is congestion and delays occurring within the transport network. Methods for understanding the post event peak are similar to the event build up in which counts would need to be conducted.
These three stages of the Event Activity are demonstrated in figure 1. Together with the data sources identified, understanding the phases of the event assist to strengthen our understanding of the event and the data available for analysis.
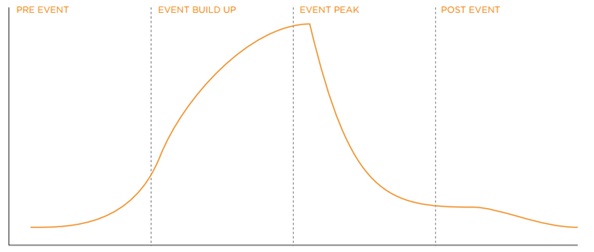
Event Life Cycle
Counting people at each phase of the event is crucial to understanding the count at any one time as well as the dynamic movement and catering for this over space and time. The result is a Crowd Counting Toolbox. The toolbox is part new technology with sensors to detect the number of people with an area combined with old-tech, down-to-earth, with people on the ground doing manual counting to cover areas that the aerial camera can’t see or where we are enable to place sensors.
Before delving into the technical solutions we need to understand the event space and the capacity of the event. The process of site planning and capacity analysis measuring the site area to be occupied, not including the areas designated for entertainment and administrative functions. This process enables the true area for the crowd to be calculated. Tools for automating this process exist for example Poynter and further discussion of crowd size measurements are available here.
Our next post will elaborate on the tools used to measure different types of crowds.